
Coming early 2027
Datum
Your bloodwork, measured against you.
Lab ranges are built from everyone. Datum keeps every result you've ever had and shows when you move away from your own usual, even while the lab range says normal. Then it gives you one clear page to take to your doctor.
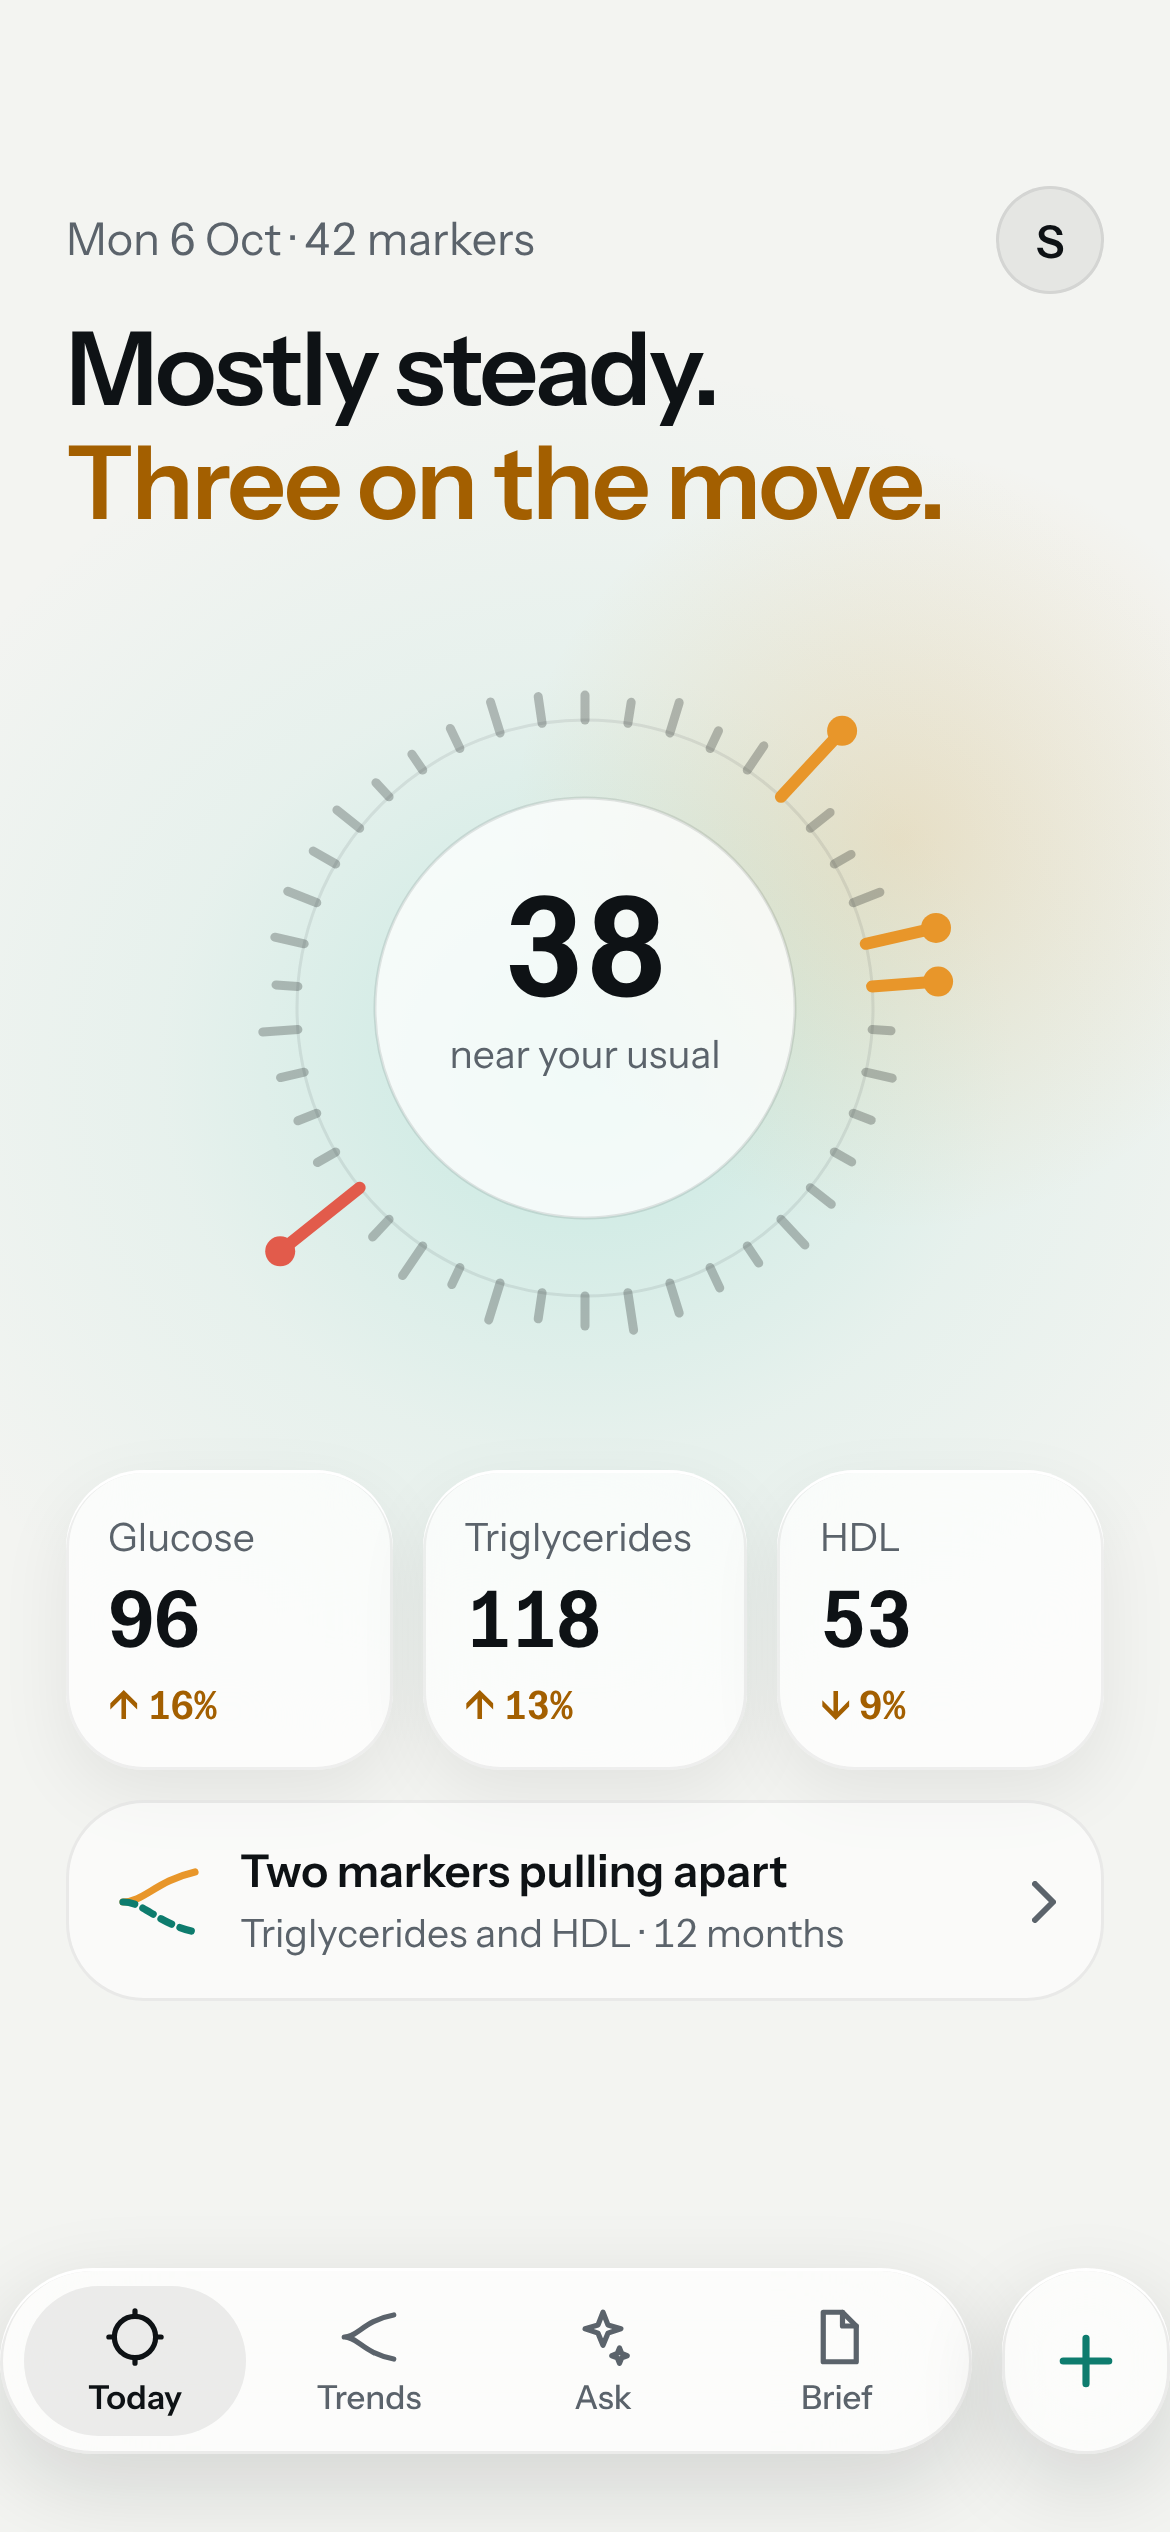
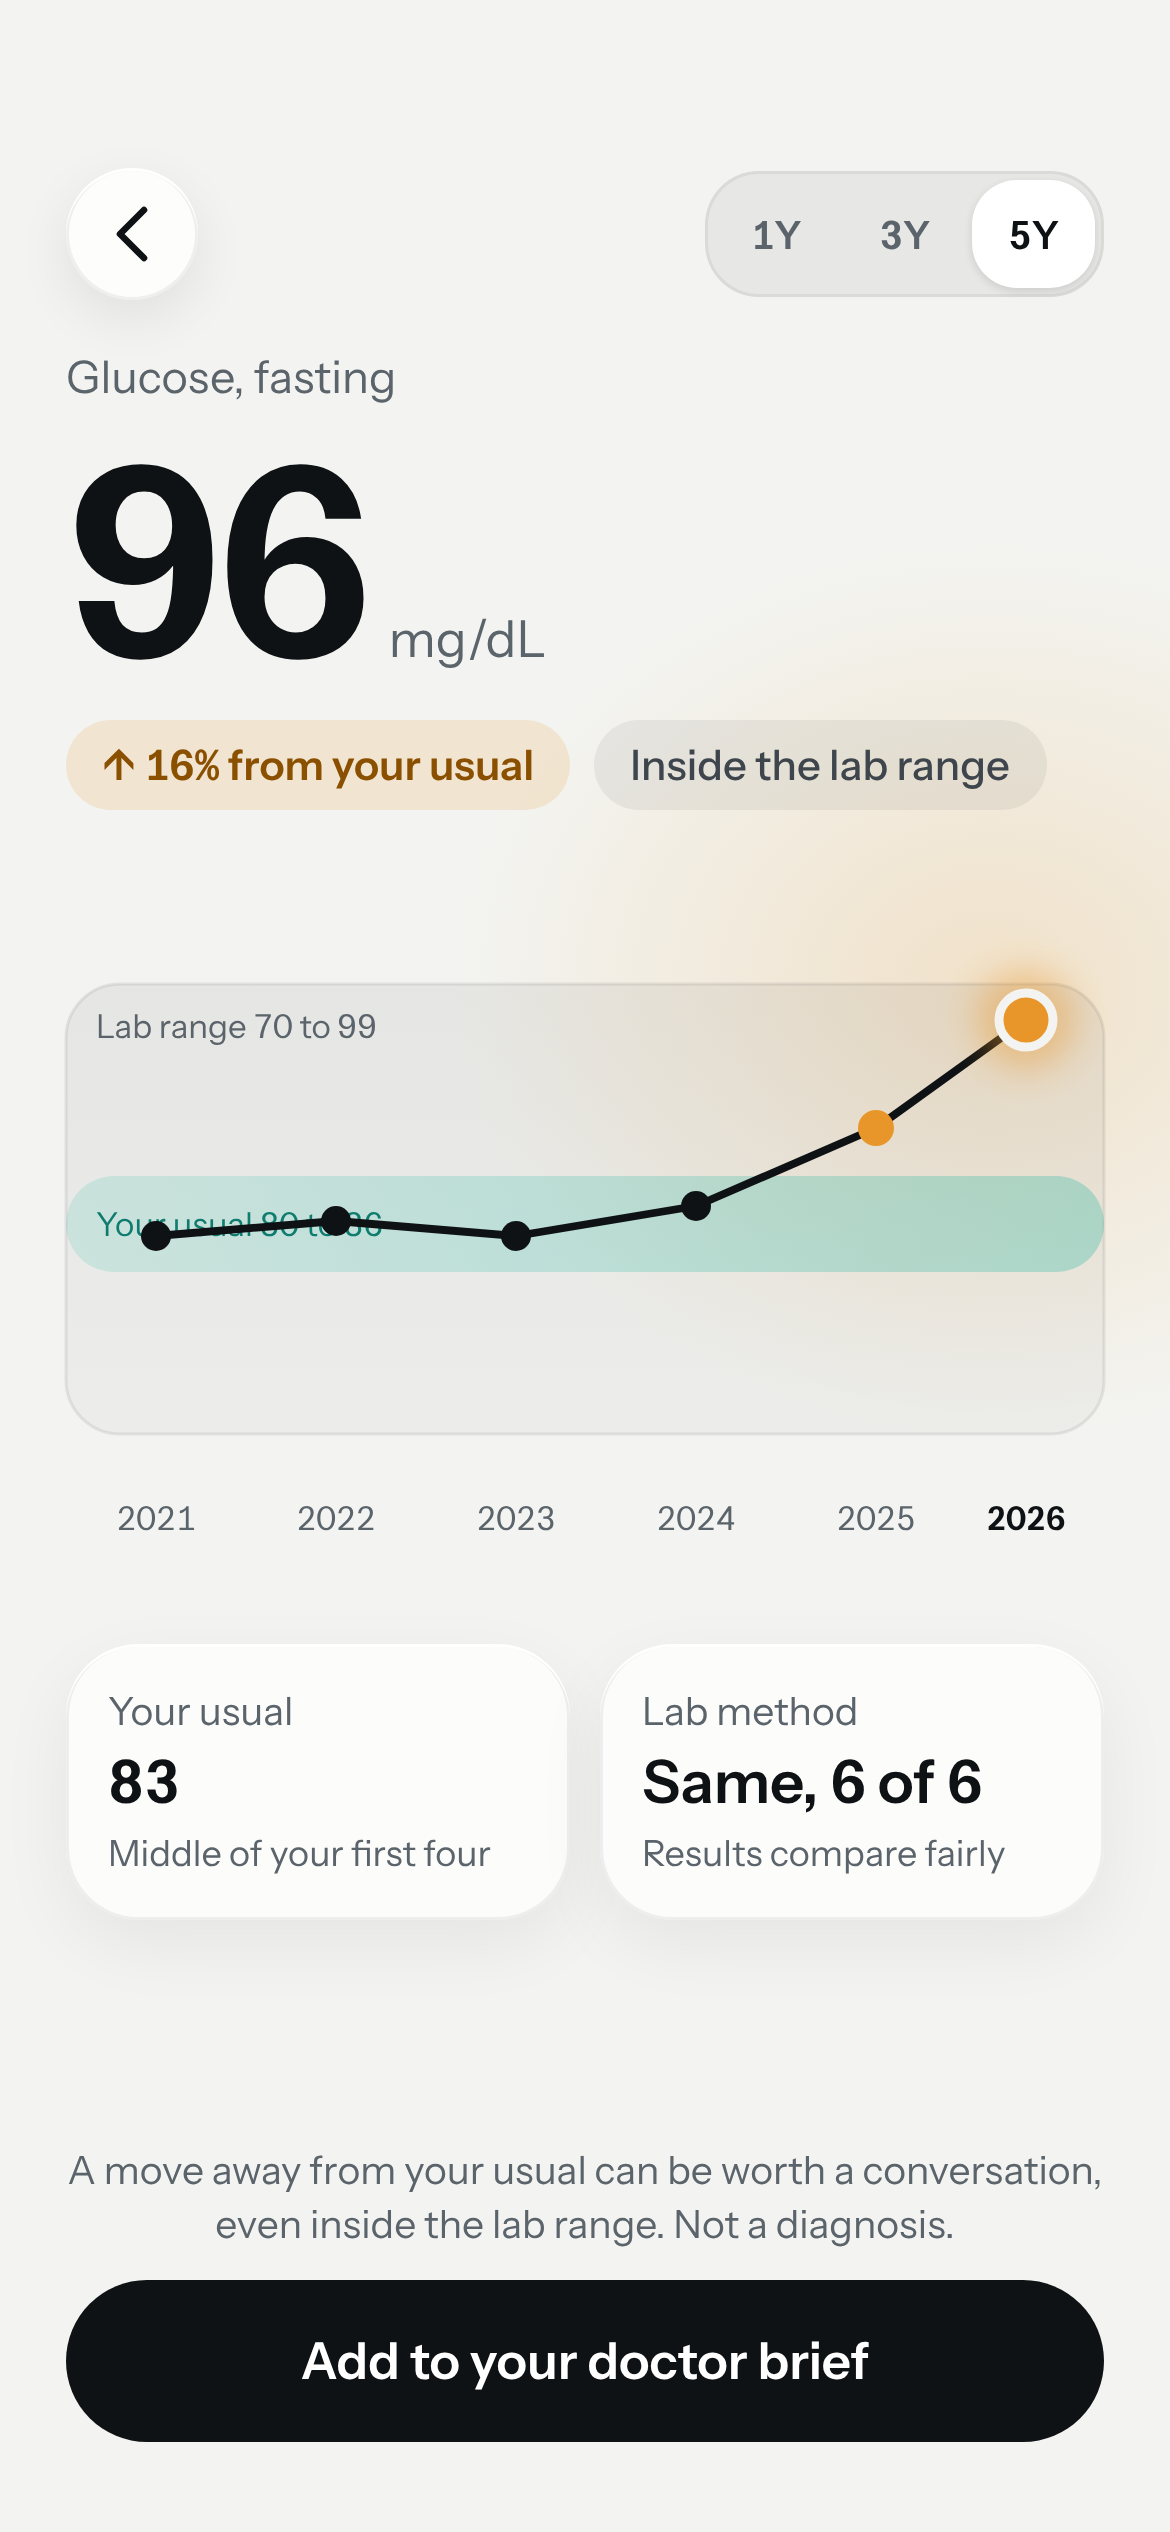
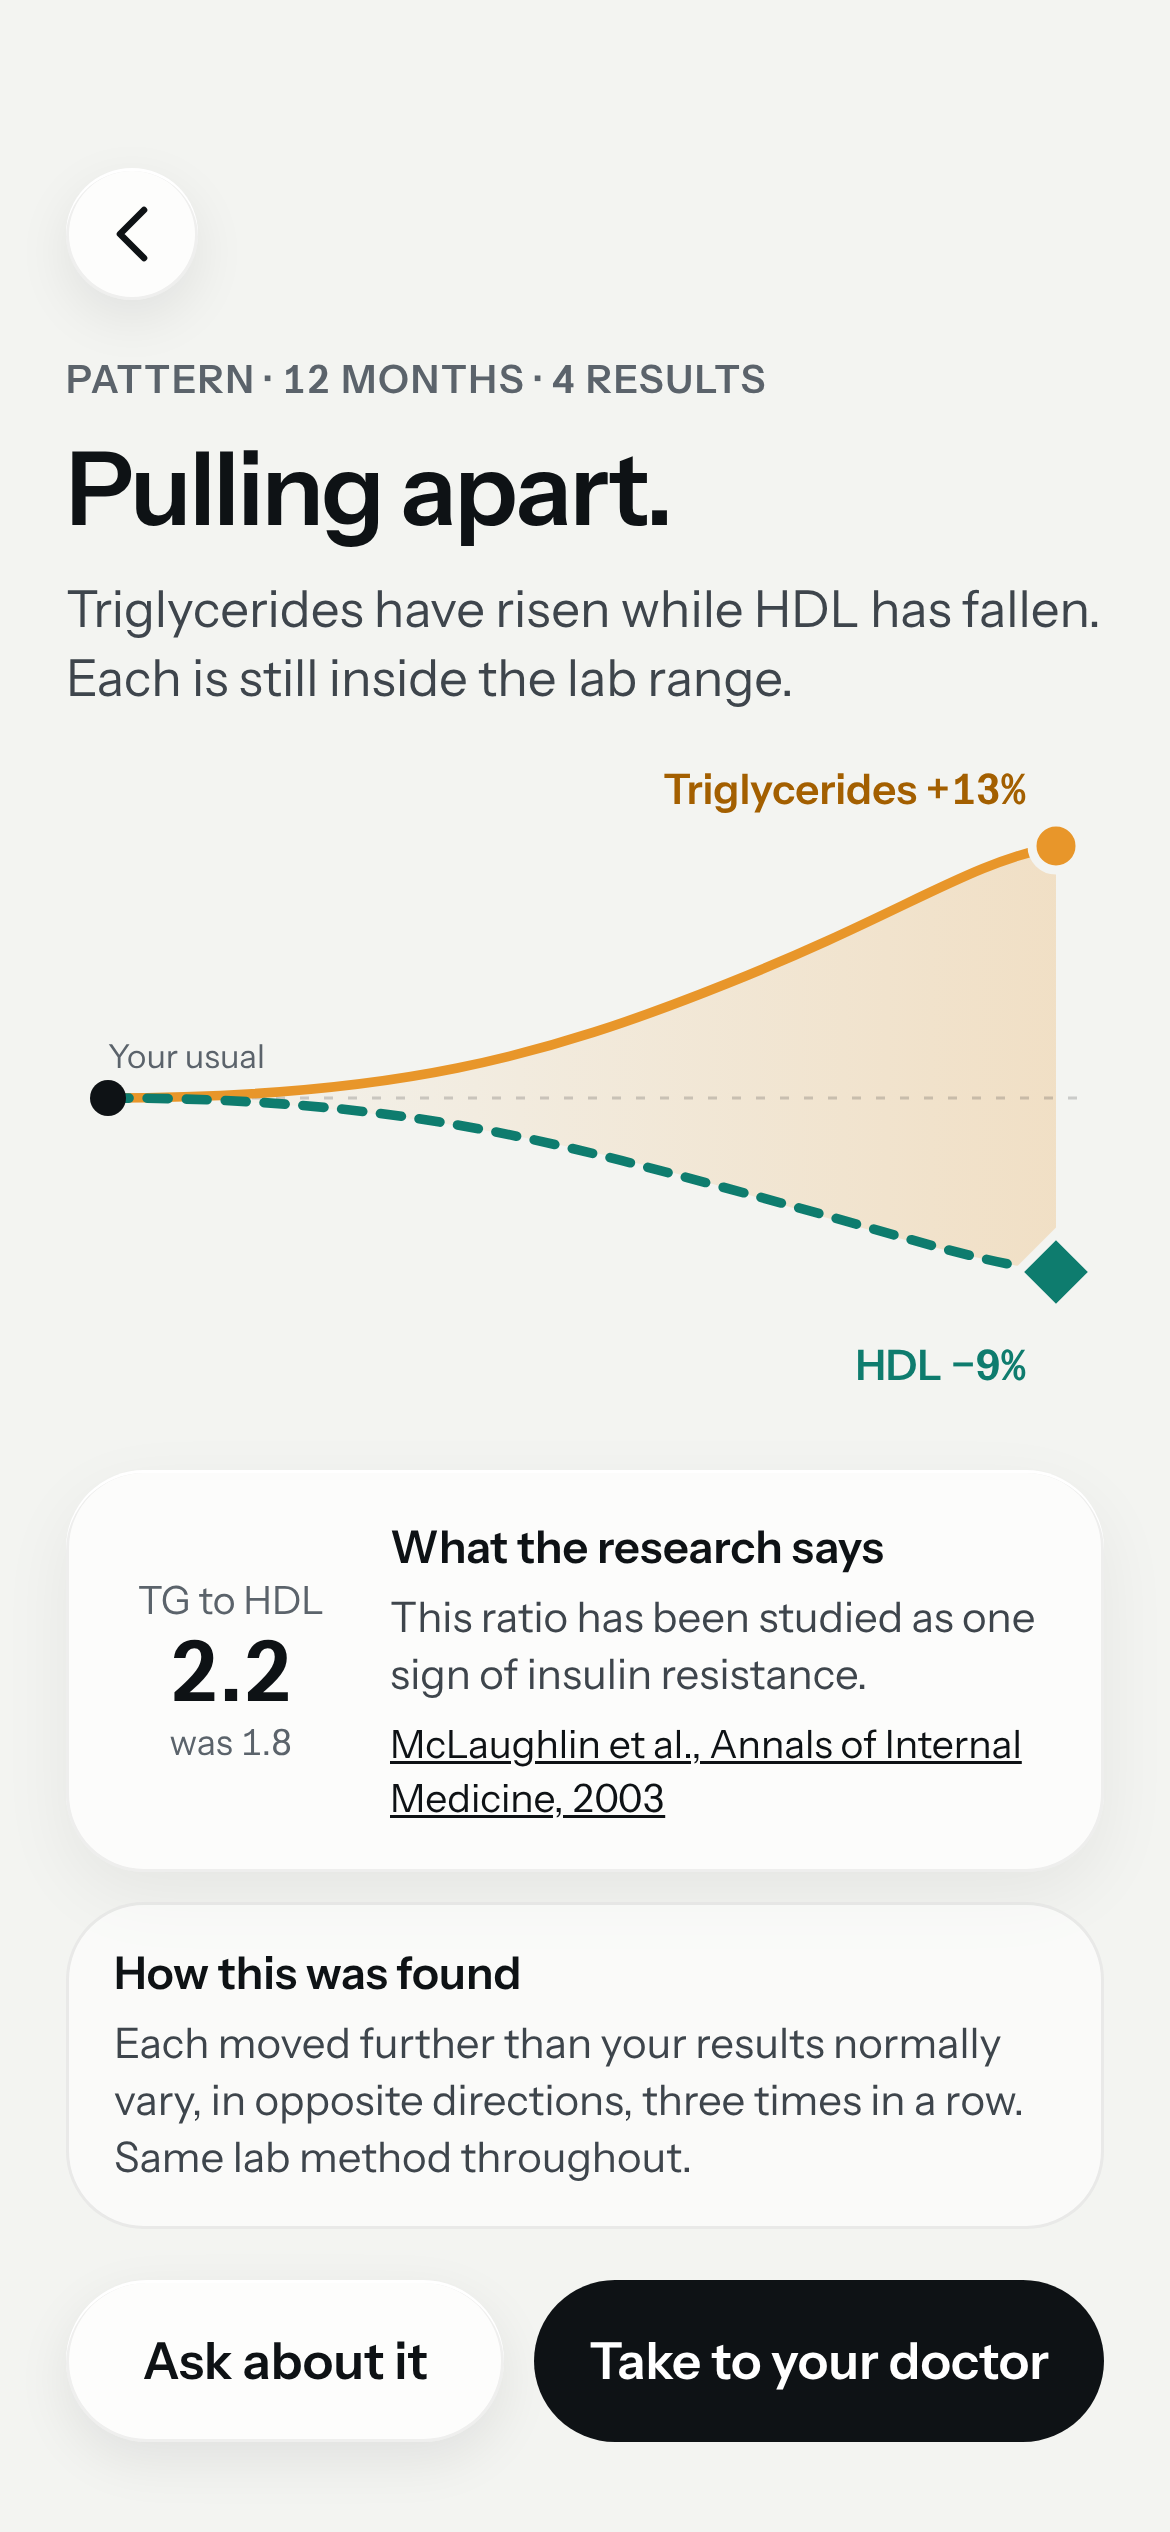
Know when something changes, while there's still time to act.
A result can look "normal" for years while it moves steadily away from where your body usually sits. Datum watches for that move, and only speaks up when it's real.
-
See change while your results still look normal.
Datum compares every result with your own usual, not a range built from everyone.
For the curious. A lab range usually covers the middle 95% of a healthy reference group. For many markers, one person moves within a far narrower band.1
-
No false alarms.
A change only counts when it's bigger than lab error and your body's normal ups and downs put together.
For the curious. The reference change value from laboratory science: RCV = √2 · 1.96 · √(CVA² + CVI²), with published variation figures for each marker.1, 2
-
See what your doctor would want to see.
Some markers mean more together than apart. Datum shows you when they move together, and the research behind it.
For the curious. For example, triglycerides rising as HDL falls. Their ratio has been studied as one sign of insulin resistance.3
-
Trends you can trust.
A change of lab or machine never shows up as a change in you.
For the curious. Every result is matched to its standard test code (LOINC), lab method and unit. A vitamin D result by immunoassay and one by mass spectrometry are charted apart.
OPEN BY DESIGN
No black box. Every flag shows its working.
You, and your doctor, can always see exactly why Datum said what it said.
- Your numbersEvery value behind a flag, with its date, unit and lab method.
- The rule that firedIn plain words, with the calculation one tap away.
- The published sourceThe research it rests on, named and linked.
Every rule Datum uses is published for anyone to read and check.
Read how Datum decides- Fraser CG. Biological Variation: From Principles to Practice. AACC Press, 2001.
- Carlsen S, Petersen PH, Skeie S, Skadberg Ø, Sandberg S. Within-subject biological variation of glucose and HbA1c in healthy persons and in type 1 diabetes patients. Clinical Chemistry and Laboratory Medicine. 2011;49(9):1501–1507.
- McLaughlin T, et al. Use of metabolic markers to identify overweight individuals who are insulin resistant. Annals of Internal Medicine, 2003.